Methodology
· Generate a comprehensive list of candidate institutions from predetermined groups (Carnegie peers, IPEDS peers, Women’s College Coalition members, LVAIC schools). Senior staff and faculty may suggest additions.
· Construct a list of 15-20 quantitative variables (values must be publicly attainable) endorsed by faculty and senior staff.
· Calculate a similarity score for each candidate institution; this score will measure each school’s similarity to CCC.
· Order the schools by their similarity scores.
· Reach agreement on the desired size of the peer group; produce the peer group consisting of that number of institutions from the top of the similarity list.
The following graphic illustrates this process geometrically. CCC is at the center. The similarity score calculated for each school represents its distance from CCC. Note that this is a two-dimensional model, whereas we are working with many more variables. However, the basic algorithm is the same and this graphic illustrates the statistical process.
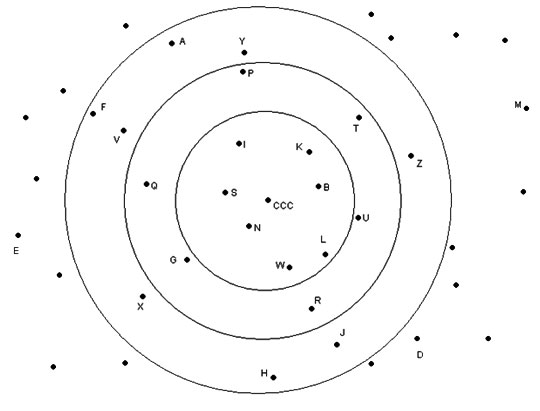
Peer Group of size 7: Colleges K, W, B, L, S, N, I
Peer Group of size 12: Colleges K, W, B, L, S, N, I, Q, G, R, T, U
Peer Group of size 20: Colleges K, W, B, L, S, N, I, Q, G, R, T, U, F, B, X, H, J, Y, A, Z
A peer group is determined by drawing a circle with CCC as the center. The size (radius) of the circle determines how many peer “points” lie in our peer group. Alternatively, we can decide on the number of peers we wish to have and draw the circle accordingly.